Templates for creating interval-denominated performance measures in Ursa Studio
There are three tools for easily creating interval-denominated performance measures in Ursa Studio.
- The first tool to utilize when creating a new measure is to see if there is an existing measure that can be cloned. Interval-denominated measures like those denominated by member-months or 1000 member-years can easily be cloned and modified.
- The second tool is the Count of Event N template. This template is appropriate for measures where the desired result is the count of events or the sum of an event’s property expressed as a rate per designated unit of elapsed time. Note to calculate the sum of an event’s property, the measure’s numerator contribution should be changed to the Value of Field pattern.
- The last tool is the Interval D Containing Multiple Instances of Event N template. This template is appropriate for measures where the opportunity for performance can be represented as an interval (Interval D) and performance can be assessed based on the existence, timing, and/or characteristics of one or more events that fall within that interval (Event N).
Key specifications for interval-denominated measures
The key specifications for interval-denominated measures can be reviewed with the context that measure properties are divided into structural panels. Here we are representing three common structural panels and the consideration to the denominator base object.
Denominator Base Object
- Interval-denominated measures use timelines objects, like the [DM/URSA-CORE] Data Mart for URSA-CORE Patient Timelines, for their denominator base objects.
Configuration
- Temporal Structure: Interval
- Denominator Case Effective Start Date: Period Start Date
- Denominator Case Effective End Date: Period End Date
- Component Class: Long Form
Numerator-Denominator Relationship
- Foreign Key: The numerator stack’s Patient ID = the denominator stack’s Patient ID
- Keep In Interval: Keep only rows where the numerator’s event date is between the Segmented Period Start Date and Segmented Period End Date
Numerator and Denominator Contributions
- Numerator Contributions
- Case Is Null
- Case When
- Value of Field
- Denominator Contributions
- Elapsed Time
Example Interval-Denominated Performance Measures
Total plan spending on ED visits per month
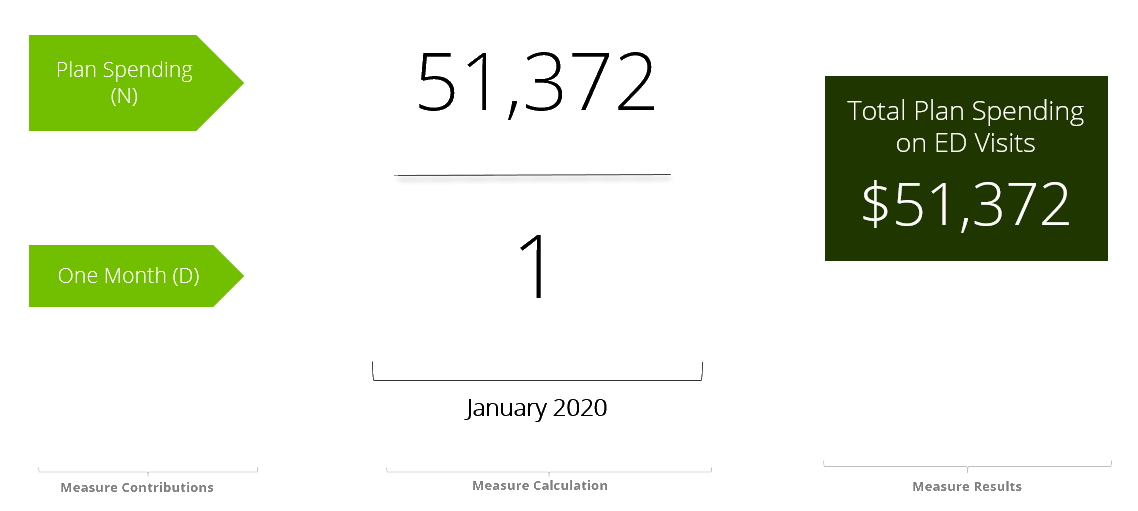
This first example provides insight into the structure of an interval-denominated measure that identifies total monthly plan spending on ED visits. In this case, our denominator observation is one because it represents a single month, January 2020. Our numerator is the sum of spending on ED visits that occurred within this reporting period. The measure result for the January 2020 reporting period is $51,372, which is produced by dividing the numerator by the denominator.
Per member per month plan spending on ED visits
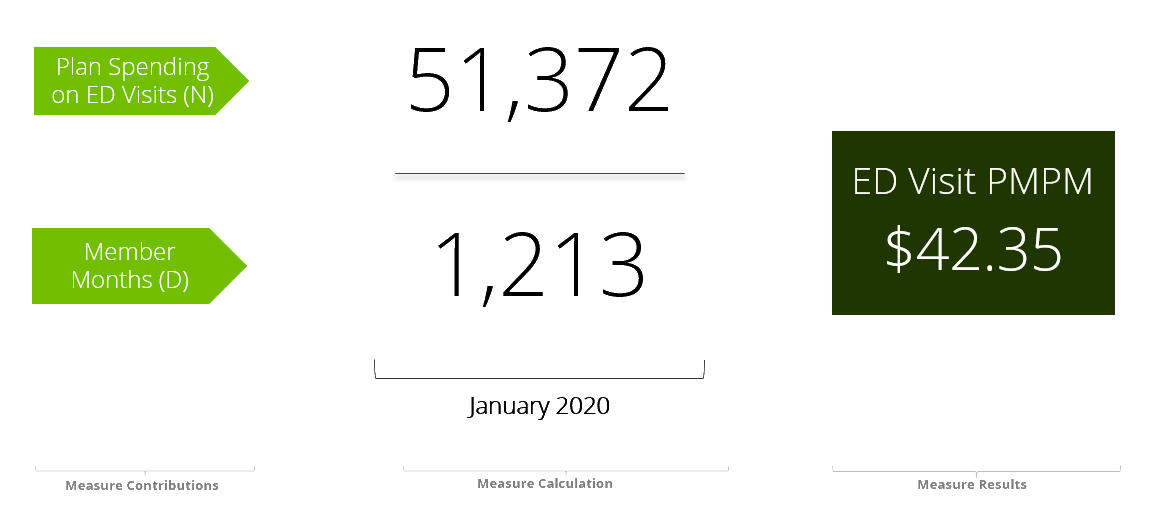
In this example, we are looking at per member per month plan spending on ED visits. The measure is denominated by the 1,213 member months in the January 2020 reporting period. As we saw in the previous example, the total plan spending on ED visits in January 2020 was $51,372. When we divide total plan spending by member-months we get a PMPM value of $42.35 for the reporting period. This is an example of a long-form measure because each member-month could be multiple claim records. We have worked with clients who calculate member months in different ways, and later on in the presentation, we will review the various ways member months can be calculated in Ursa Studio.
Rate of ED visits per 1000 member-years
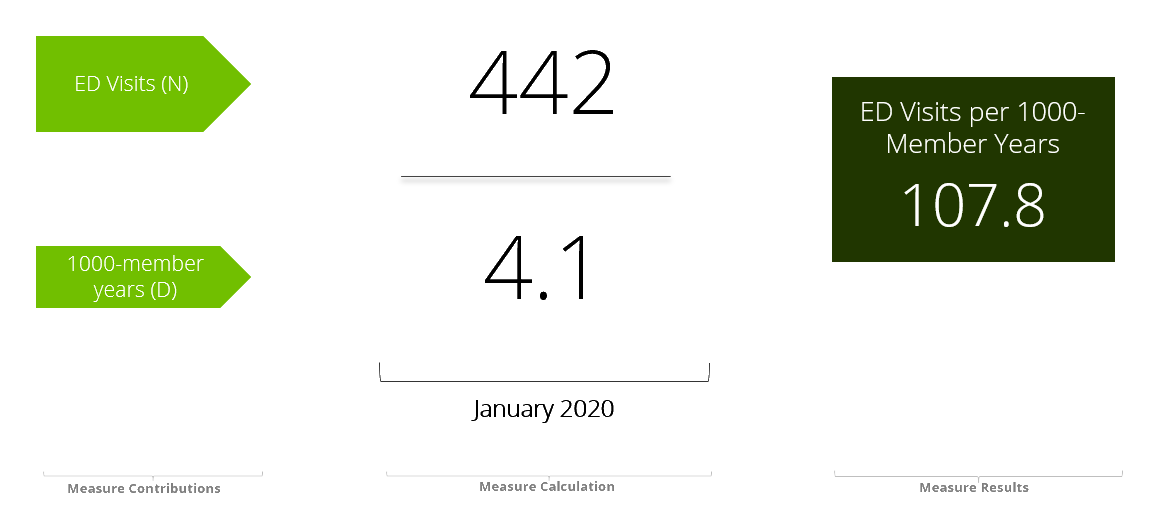
Our final example is a measure that identifies the rate of ED visits per 1000 member-years. The measure's denominator is 4.1. This means that in January 2020 there were 4.1 1000 member-year periods. During the same reporting period there were 442 ED Visits. Based on those inputs, the measure's result is 107.8 ED Visits per 1000 member-years. This is an example of a long-form measure because each member could have multiple ED visits per reporting segment.
Timelines objects used in interval-denominated measures
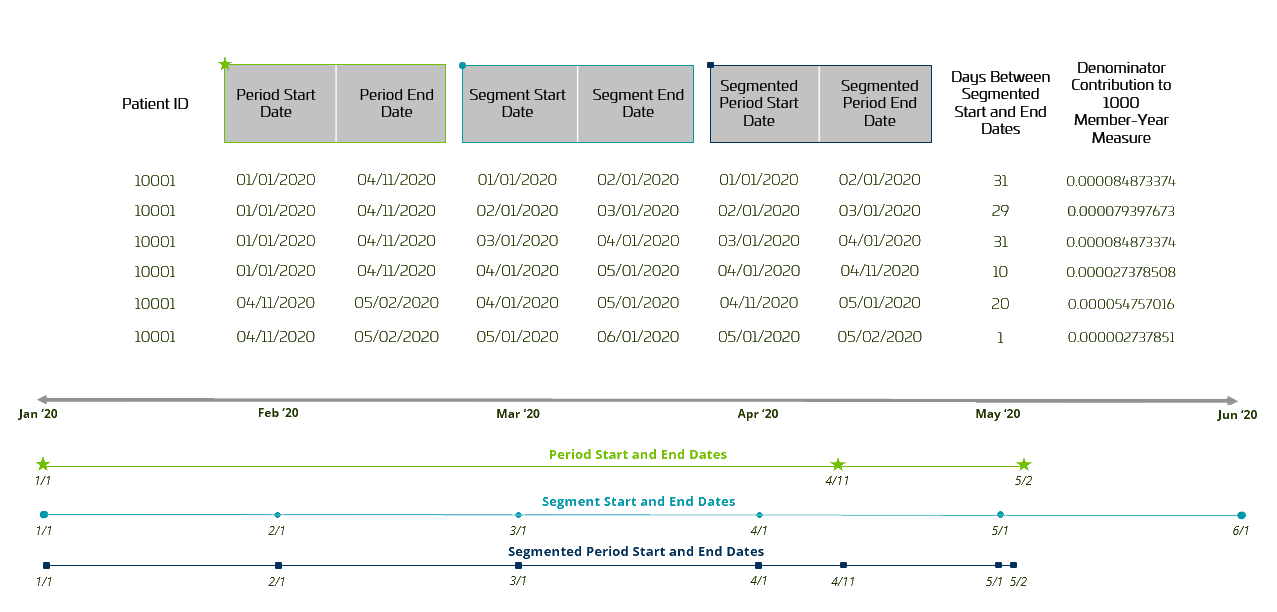
Timelines objects are used to determine the number of days patients meet denominator inclusion criteria. Here we will look at the key fields involved in that process. The interval defined by the period start and end date fields is segmented to align with the reporting periods created for presenting a measure’s results.
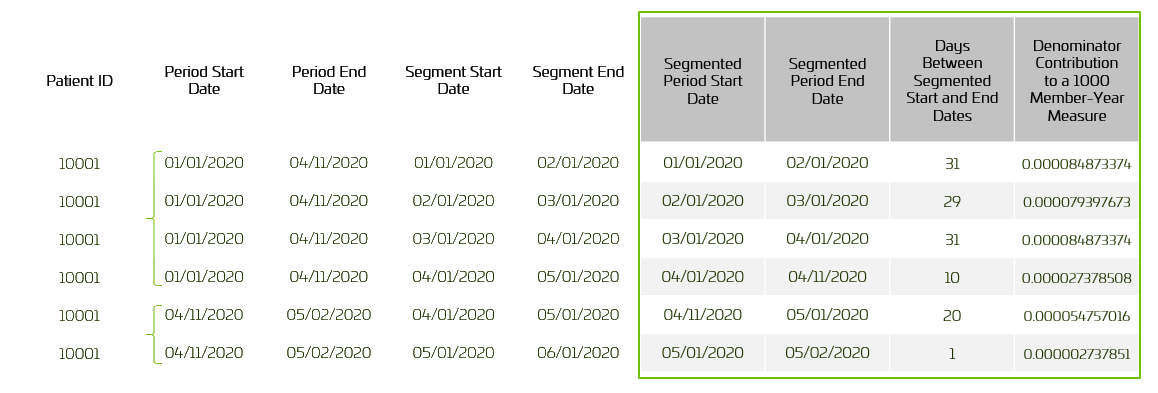
This table show two timeline periods for a single patient. We can see those two periods in the period start and end date columns.
- The Period Start Date and Period End Date fields represent the beginning and ending of an interval when the patient’s state, as defined by the fields included on the timelines object, did not change. These fields are generated when a timelines object is created. In this example, two intervals span five reporting segments. Please note, Ursa Health’s date standard concerning intervals is to is inclusive of the interval’s start date and exclusive of the interval’s end date.
The table also shows how these timelines cover five reporting periods, January to May 2020. We can see those reporting period in the segment start and end date columns.
- The Segment Start Date and Segment End Date fields represent the beginning and ending of the measure’s reporting period. These fields are generated when a report is created and are based on the report’s periodicity. This example has five distinct reporting periods.
The third set of date columns, the segmented period start and end date fields, are a combination of the period start and end date columns and the segment start and end date columns. The Segmented Period Start Date is generated by taking the maximum value from the Period Start Date and Segment Start Date fields, and the Segmented Period End Date is generated by taking the minimum value of the Period End Date and Segment End Date fields.
- The Segmented Period Start Date and Segmented Period End Date fields represent the beginning and ending of a reporting period’s segments. Sometimes these segments align with the start and/or end of a reporting period while other times there are multiple segments in a single reporting period. In this example, there are two segments in the April reporting period. These segments are used to calculate an observation’s contribution to the interval measure’s denominator. This is accomplished by taking the number of days between the Segmented Period Start Date and Segmented Period End Date and calculating those days contribution to the measure’s denominator (e.g., 1000 member-years). In this example, 31 days contributes 0.000084873374 to a single 1000 member-year period.
Date fields relevant to interval-denominated measures
Here we see a visual example of what we discussed in the previous section. In the time period for January 1, 2020 to June 1, 2020, the patient has two timeline periods that extend across five reporting period. The denominator contribution from the timelines object is calculated after segmenting the timelines to align with the reporting periods.
Various ways to calculate member-months/years
Now let's look at different ways the interval temporal structure is used to calculate member-months and years.
An example of a member-month denominated measure using elapsed time in months
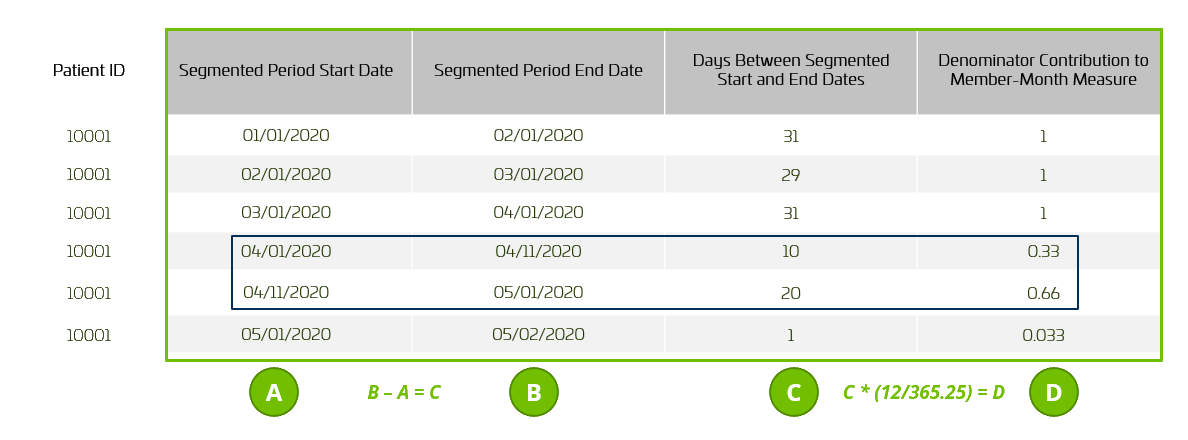
In this example, Ursa Studio is calculating the time elapsed in months. As previously noted, when member-months are calculated for a measure's denominator, they are calculated using the segmented period start and end date fields.
-
In scenarios where a single, segmented observation covers one month, then the contribution to the measure's denominator value will be equal to one because the platform recognizes the single observations total number of days as representing a month.
- For example, the first record covers all 31 days in January. Using the elapsed time in months standard, Ursa Studio calculates that the first record contributes one member month to the denominator.
-
In scenarios where there are multiple, segmented observations for a single month, then the contribution to the measure's denominator value will be sum of the contributions from all observations, which will be less than or greater than one.
- For example, the fourth and fifth records span the month of April, but contribute 0.99 member-months to the denominator. Why? The measure will calculate the forth observation's contribution to the denominator as 10 days multiplied by 12 months divided by 365.25 days or 10*(12/365.25) which is equal to 0.33 member-months. The second observation's contribution will be calculated the same way and result in 0.66 member-months. When these two observations’ denominator contributions are added together the total is 0.99 member-months even though the two observations represent the total number of days in one month. If this example had used January instead of April, the member-month contribution would have been greater than one.
Below is a representation of the SQL that is used to generate member-month contributions:
CASE WHEN EXTRACT(DAY FROM end_date) = 1 AND EXTRACT(DAY FROM start_date) = 1 THEN (DATE_PART('YEAR', end_date) - DATE_PART('YEAR', start_date)) * 12 + (DATE_PART('MONTH', end_date) - DATE_PART('MONTH', start_date))
ELSE EXTRACT(DAY FROM (end_date - start_date)) * 0.03285420944558522 END AS Denominator
Note: The start_date and end_date fields in this snippet represent the segmented_period_start_date and segmented_period_start_date fields.
An example of a member-month denominated measure using elapsed time in twelfths of a year
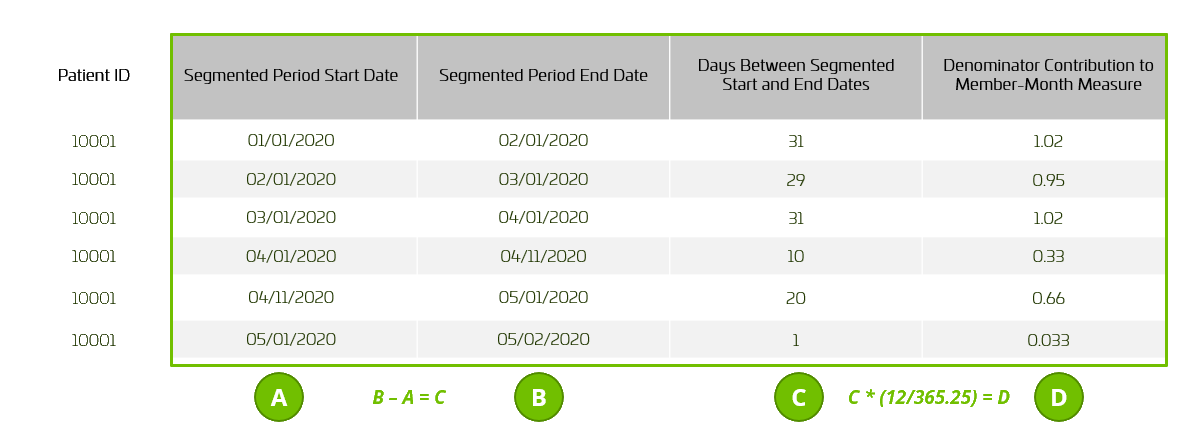
Another way the interval temporal structure is used to calculate member-months is calculate the time elapsed in twelfths of a year.
Here, the same process as outline in the previous slide occurs with one exception - even when a single observations days represent 1 month, the contribution is not rounded up or down to one.
- For example, the first record covers all 31 days in January. Using the elapsed time in twelfths of a year standard, Ursa Studio calculates that the first record contributes 1.02 member-months to the denominator. Sometimes our clients want the contribution of one member-month for each member regardless of how many days of membership they had in a month. If this is the standard your organization uses, let's set up time with your TCSM to review implementation of this method.
An example of a 1000 member-year denominated measure
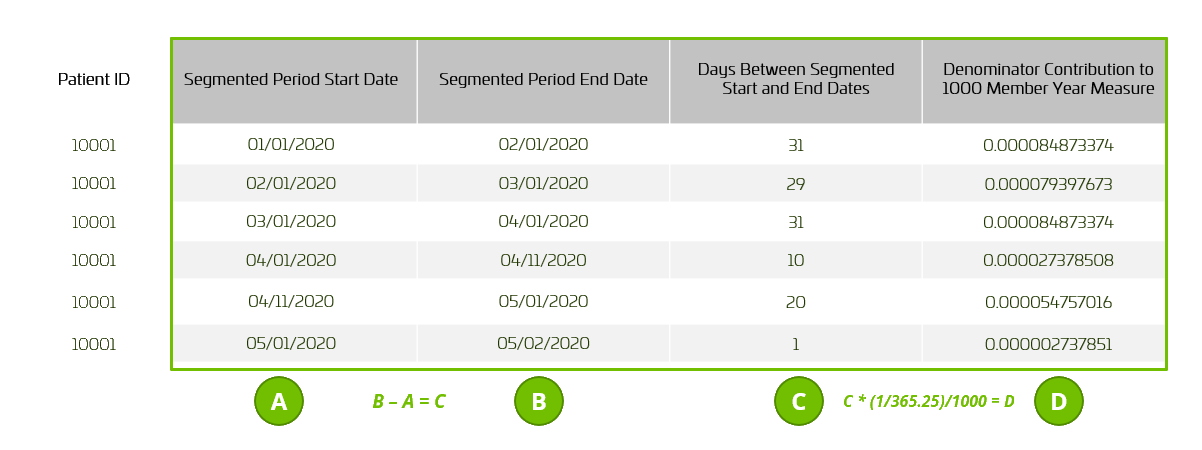
This table exhibits the calculation used to determine 1000 member-year denominator contributions. The process for calculating the number of days per reporting period is the same as we have previously discussed. The only difference between member-months and 1000 member-years contribution is in the calculation applied to the days calculated.