Templates for creating population measures in Ursa Studio
There are four tools for easily creating population measures in Ursa Studio.
- The first tool to utilize when creating a new measure is to see if there is an existing measure that can be cloned.
- The second tool is the Registry of Entities template. To create a measure of the count of active plan members, we would use this template. When creating an entity-denominated measure, always use a timelines object like [DM/URSA-CORE] Data Mart for URSA-CORE Patient Timelines for the denominator input (i.e., denominator base object).
- The third tool is the Registry of Events template. To create a measure of the count of hospital inpatient admissions, we would use this template. When creating event-denominated population measures, it is frequently the case that an encounter object like [DM/URSA-CORE] Data Mart for Hospital Inpatient Admission Encounters is used for the denominator input.
- To create a static measure, we would use the Registry of Static Records template. Static measures list records without charting their relationship to time.
Event-Denominated Population Measure
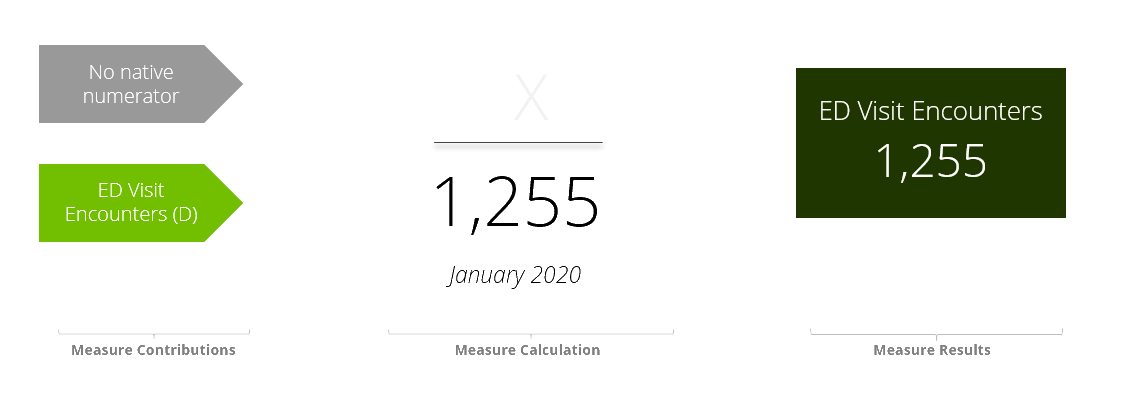
Example: Count of emergency department visit encounters

In this example, there are 1,255 encounters that occurred during the January 2020 reporting period. Even though population measures do not have a native numerator value, these encounters are considered denominator observations. This is because population measures can be converted to rate measures in Analytics Portal using the Measure Expressions feature.
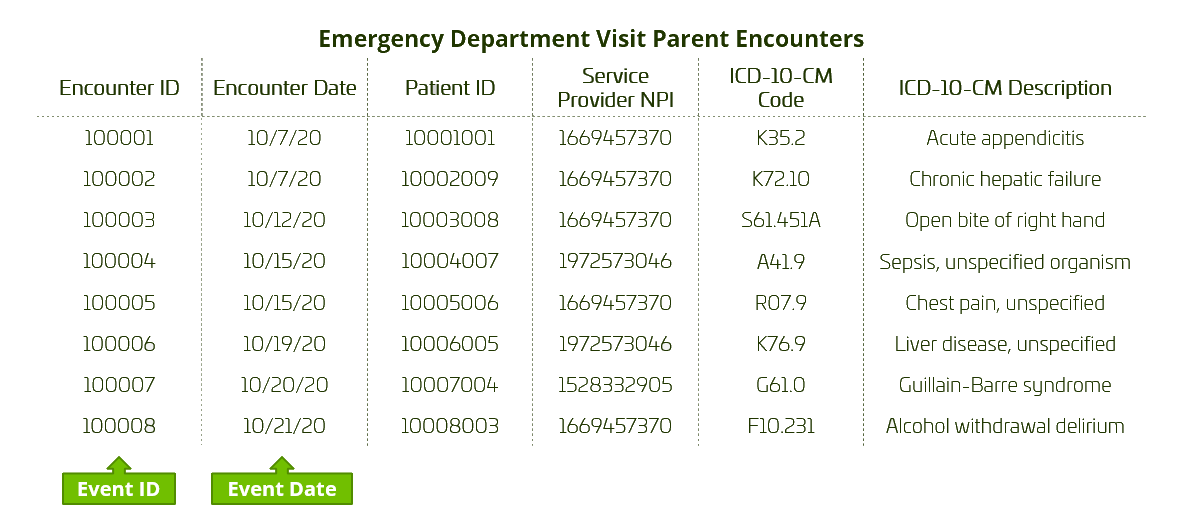
Example timelines data structure used with event-denominated population measures

Here is an example of the data structure used with Registry of Event template. It shows the underlying object, which in this case is the emergency department visit parent encounters object, that would be used to create a population measure counting the number of ED visits. The object has a few important properties that are required to create this type of measure. First, there is an Event ID which uniquely identifies each event, and an event date, which identifies the date of the encounter. The object will also other useful information, but these two properties are essential.
Entity-Denominated Population Measure
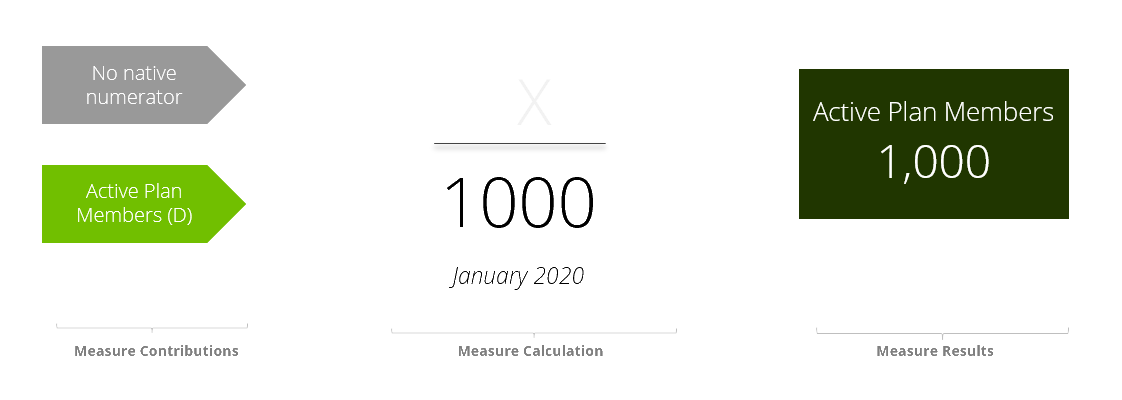
Example: Count of active plan members

In this example, there are 1,000 active plan members as of January 2020 reporting period. Even though population measures do not have a native numerator value, these members are considered denominator observations. This is because population measures can be converted to rate measures in Analytics Portal using the Measure Expressions feature.
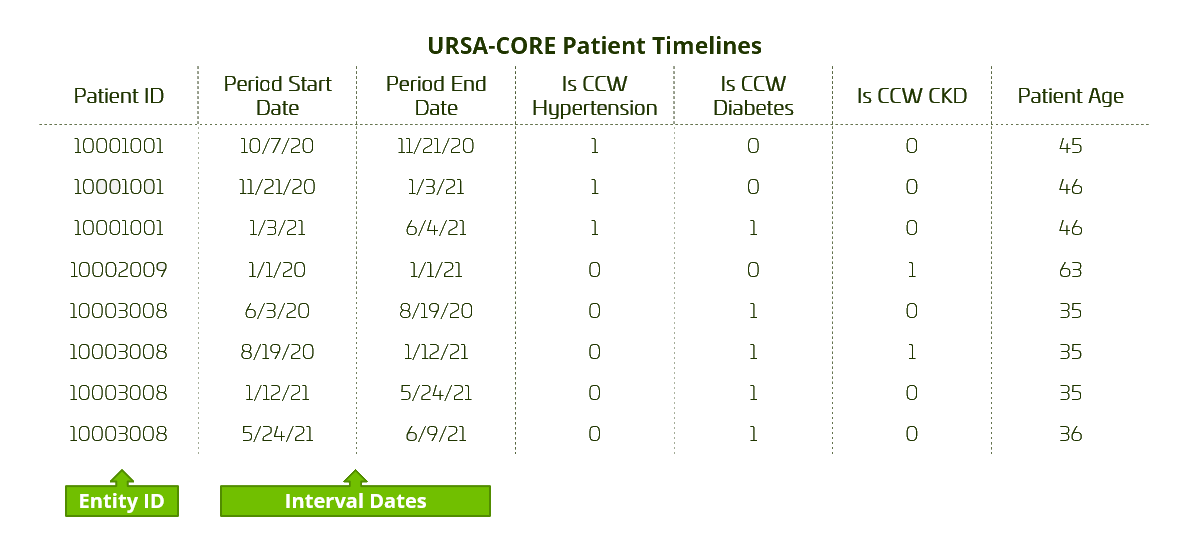
Example timelines data structure used with entity-denominated population measures

Here is an example of the data structure used with Registry of Entity measures. It shows the underlying object, a timelines object, that is used as the input for entity population measures. We can see a few important properties including the Patient ID which uniquely identifies each entity, and the Period Start Date and Period End Date, which identifies the interval of time the patient’s state, as represented by the other fields on the table, was unchanged.